M10 · Observability & Tracing
Goal: see inside a running agent — wire OpenTelemetry tracing to Application Insights, capture spans from a real call, then run continuous evaluation on live traffic. You'll use:
configure_azure_monitor,AIProjectInstrumentor, the Responses API, andevaluation_rules.create_or_update.
In M9 you scored a fixed test set before shipping. Production is the other half of the quality loop: once an agent is live, you need to know what it did, how long it took, and whether quality held — without re-running a notebook.
Two complementary surfaces give you that:
            ┌─ OpenTelemetry tracing ──▶ spans ──▶ Application Insights (you own the data)
agent call ─┤
            └─ continuous evaluation ──▶ sampled scores ──▶ Foundry portal Monitor tab
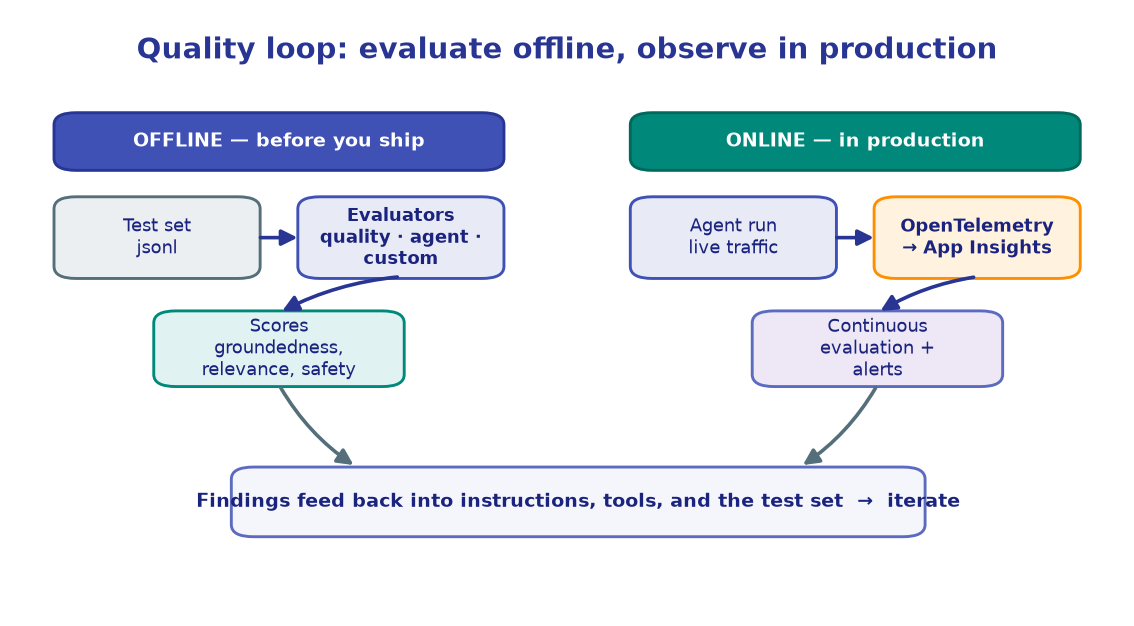
Tracing is client-side: you configure an exporter and every SDK operation emits spans. Continuous evaluation is server-side: Foundry samples live responses and scores them automatically. You'll set up both.
1. Configure
Same .env as every lab, plus one observability key: APP_INSIGHTS_CONN_STRING — the
connection string of an Application Insights resource that will receive your traces.
import os, time
from dotenv import load_dotenv

load_dotenv()  # reads .env from the repo root

PROJECT_ENDPOINT = os.environ["PROJECT_ENDPOINT"]
CHAT_MODEL       = os.environ.get("CHAT_MODEL", "gpt-4.1-mini")
APP_INSIGHTS_CONN_STRING = os.environ["APP_INSIGHTS_CONN_STRING"]

AGENT_NAME = "observability-demo-agent"

print("Project      :", PROJECT_ENDPOINT)
print("Chat         :", CHAT_MODEL)
print("App Insights :", APP_INSIGHTS_CONN_STRING[:40] + "...")
!!! note "Where does App Insights come from?"
Provisioning the Application Insights resource and copying its connection string into
.env is a one-time platform task — see the Platform docs.
The reference deploys it with Bicep; in this lab we assume it already exists and just
read APP_INSIGHTS_CONN_STRING.
!!! note "Expected output"
Project : https://<account>.services.ai.azure.com/api/projects/<project> Chat : gpt-4.1-mini App Insights : InstrumentationKey=abc123...;IngestionEndpoint=...
2. Wire OpenTelemetry to Application Insights
configure_azure_monitor() sets up the whole OpenTelemetry pipeline in one call — a
TracerProvider with an Azure Monitor exporter pointed at your connection string. This
must run before you instrument the SDK or build any client.
from azure.monitor.opentelemetry import configure_azure_monitor
from opentelemetry import trace as otel_trace
from opentelemetry.sdk.trace import TracerProvider

# Idempotent: don't reconfigure if a provider is already installed (safe re-runs).
if isinstance(otel_trace.get_tracer_provider(), TracerProvider):
    provider = otel_trace.get_tracer_provider()
    print("Reusing existing TracerProvider")
else:
    configure_azure_monitor(connection_string=APP_INSIGHTS_CONN_STRING)
    provider = otel_trace.get_tracer_provider()
    print("OpenTelemetry configured with Azure Monitor")

print("TracerProvider ready")
!!! note "Expected output"
OpenTelemetry configured with Azure Monitor TracerProvider ready
On a second run you'll see "Reusing existing TracerProvider" instead — calling
configure_azure_monitor twice in one process would stack exporters.
3. Instrument the Foundry SDK
The pipeline is ready, but the SDK won't emit spans until you instrument it.
AIProjectInstrumentor().instrument() patches the client so every operation — chat,
responses, tool calls — produces a span. This must happen before you build the
client. enable_content_recording=False keeps prompt/response bodies out of telemetry
(spans, timings, and token counts are still captured).
from azure.ai.projects.telemetry import AIProjectInstrumentor

AIProjectInstrumentor().instrument(enable_content_recording=False)

print("Azure AI Projects SDK instrumented")
print("  content recording : disabled (spans + token counts still captured)")
!!! note "Expected output"
Azure AI Projects SDK instrumented content recording : disabled (spans + token counts still captured)
!!! warning "Order matters"
configure_azure_monitor → instrument() → then build clients. Instrumenting
after a client exists means that client's calls won't be traced. Re-run from section 2
in order if you see empty traces.
4. Build the client and a small agent to watch
Now — after instrumentation — build the client and create a tiny agent to trace. This
mirrors M2: a PromptAgentDefinition
versioned under a stable name. Because the client was built post-instrumentation, every
call it makes will be traced automatically.
from azure.identity import DefaultAzureCredential
from azure.ai.projects import AIProjectClient
from azure.ai.projects.models import PromptAgentDefinition

credential     = DefaultAzureCredential()
project_client = AIProjectClient(endpoint=PROJECT_ENDPOINT, credential=credential)
openai_client  = project_client.get_openai_client()

agent = project_client.agents.create_version(
    agent_name=AGENT_NAME,
    definition=PromptAgentDefinition(
        model=CHAT_MODEL,
        instructions="You are a concise assistant. Answer in one or two sentences.",
    ),
)

print("openai_client :", "ready")
print("agent         :", agent.name, "v" + str(agent.version))
!!! note "Expected output"
openai_client : ready agent : observability-demo-agent v1
A 403 here means your identity lacks the Azure AI Developer role; a credential
error means az login. Same bootstrap as every lab — only the instrumentation before it
is new.
5. Make a traced call and flush
Invoke the agent through the Responses API exactly as in M2. You won't see anything
extra in the output — the spans are emitted silently to App Insights in the background.
OpenTelemetry batches spans, so we call force_flush() to push them immediately
rather than waiting for the batch timer.
queries = [
    "What is OpenTelemetry, in one sentence?",
    "Name one benefit of distributed tracing.",
]

for q in queries:
    start = time.time()
    response = openai_client.responses.create(
        input=[{"role": "user", "content": q}],
        extra_body={"agent_reference": {"name": agent.name, "type": "agent_reference"}},
    )
    ms = (time.time() - start) * 1000
    print(f"Q: {q}")
    print(f"A: {response.output_text}   ({ms:.0f} ms)\n")

# Push batched spans to App Insights now (ingestion still lags ~30-60s).
provider.force_flush()
print("Spans flushed to Application Insights")
!!! note "Expected output" ``` Q: What is OpenTelemetry, in one sentence? A: OpenTelemetry is an open standard for collecting traces, metrics, and logs from applications. (812 ms)
Q: Name one benefit of distributed tracing.
A: It lets you follow a single request across services to pinpoint where latency
   or errors occur.   (734 ms)

Spans flushed to Application Insights
```
The replies are ordinary; the value is the **telemetry behind them** — see the next
section.
6. What the spans look like
Each responses.create(...) call produces a nested span tree in App Insights (the
dependencies table). Spans follow the GenAI OpenTelemetry semantic conventions, so
the attribute names are portable across tools. A single agent call typically yields:
responses                          ← outer span, one per query
  └── chat                         ← model call(s) Foundry makes
        gen_ai.request.model       = gpt-4.1-mini
        gen_ai.usage.input_tokens  = 18
        gen_ai.usage.output_tokens = 24
        gen_ai.system              = az.ai.inference
        agent.name                 = observability-demo-agent
You query these with KQL once they've ingested (~30–60s).
# A KQL query you'd run against Application Insights (Logs blade, or via
# azure-monitor-query's LogsQueryClient). Printed here for reference — uncomment
# the LogsQueryClient block to run it against your own resource id.
KQL = '''
dependencies
| where timestamp > ago(30m)
| where name has_any ("responses", "chat", "tool")
| project timestamp, span = name,
          model         = tostring(customDimensions["gen_ai.request.model"]),
          input_tokens  = toint(customDimensions["gen_ai.usage.input_tokens"]),
          output_tokens = toint(customDimensions["gen_ai.usage.output_tokens"]),
          duration_ms   = duration, success
| order by timestamp asc
'''
print(KQL)

# from azure.monitor.query import LogsQueryClient
# from datetime import timedelta
# logs = LogsQueryClient(credential=credential)
# resp = logs.query_resource(APP_INSIGHTS_RESOURCE_ID, KQL, timespan=timedelta(minutes=30))
# for row in resp.tables[0].rows:
#     print(row)
!!! note "Expected output (after ingestion)"
Running the KQL in the App Insights Logs blade returns one row per span:
timestamp span model input_tokens output_tokens duration_ms success 10:42:01 responses gpt-4.1-mini 18 24 812 True 10:42:03 chat gpt-4.1-mini 18 24 640 True
!!! tip "Two views, no extra code"
Those same traces also appear under your agent's Monitor tab in the Foundry portal
(ai.azure.com → Build → your agent → Monitor) — token usage, latency, and run
success-rate charts, server-side, with no client instrumentation. Tracing (this
section) is for your backend; the Monitor tab is for an at-a-glance dashboard.
7. Continuous (online) evaluation
Tracing tells you what happened; continuous evaluation tells you whether it was any good — automatically, on live traffic. You define an eval object (what to measure), then an evaluation rule that attaches it to your agent. Foundry samples real responses and runs the evaluator server-side; results land in the Monitor tab. No per-request code.
# (a) Eval object — reuse a built-in evaluator (relevance) as the judge.
eval_object = openai_client.evals.create(
    name="Continuous Relevance (observability demo)",
    data_source_config={"type": "azure_ai_source", "scenario": "responses"},
    testing_criteria=[{
        "type": "azure_ai_evaluator",
        "name": "relevance_check",
        "evaluator_name": "builtin.relevance",
        "data_mapping": {"query": "{{item.query}}", "response": "{{item.response}}"},
        "initialization_parameters": {"deployment_name": CHAT_MODEL},
    }],
)
print("eval object :", eval_object.id)

# (b) Evaluation rule — sample this agent's completed responses and score them.
from azure.ai.projects.models import (
    EvaluationRule, ContinuousEvaluationRuleAction,
    EvaluationRuleFilter, EvaluationRuleEventType,
)

rule = project_client.evaluation_rules.create_or_update(
    id="continuous-relevance-rule-demo",
    evaluation_rule=EvaluationRule(
        display_name="Continuous Relevance (observability demo)",
        action=ContinuousEvaluationRuleAction(eval_id=eval_object.id, max_hourly_runs=100),
        event_type=EvaluationRuleEventType.RESPONSE_COMPLETED,
        filter=EvaluationRuleFilter(agent_name=agent.name),
        enabled=True,
    ),
)
print("rule        :", rule.id, "| enabled:", rule.enabled)
!!! note "Expected output"
eval object : eval_abc123 rule : continuous-relevance-rule-demo | enabled: True
From now on, a sampled fraction of this agent's live responses are scored for relevance
automatically — the rule keeps running until you disable it.
!!! warning "API is evolving"
The continuous-eval models (EvaluationRule, ContinuousEvaluationRuleAction, …) and
the evals.create schema are preview in azure-ai-projects 2.1.x and move between
releases. Pin the version in pyproject.toml; if a field name differs, check the SDK you
installed. A 403 on the rule means the project's managed identity needs the Foundry
User role (a platform setup step).
8. See it in the portal
Generate a little traffic, then watch the scores appear. Send a few queries through the agent — the rule samples them and the Monitor tab fills in within a few minutes.
for q in ["Summarize what a span is.",
          "Why batch telemetry before exporting?",
          "What does force_flush do?"]:
    openai_client.responses.create(
        input=[{"role": "user", "content": q}],
        extra_body={"agent_reference": {"name": agent.name, "type": "agent_reference"}},
    )
provider.force_flush()

print("Traffic sent — the continuous-eval rule will score sampled responses.")
print()
print("View results:")
print("  1. Open https://ai.azure.com  (New Foundry toggle on)")
print("  2. Build -> select 'observability-demo-agent'")
print("  3. Monitor tab -> Evaluation metrics + Monitor Settings")
!!! note "Expected output" ``` Traffic sent — the continuous-eval rule will score sampled responses.
View results:
  1. Open https://ai.azure.com  (New Foundry toggle on)
  2. Build -> select 'observability-demo-agent'
  3. Monitor tab -> Evaluation metrics + Monitor Settings
```
Scores can take a few minutes to surface after the first batch. Under **Monitor
Settings** you'll see `continuous-relevance-rule-demo` listed as **Enabled** — the same
relevance evaluator from [M9](../09-evaluation/), now running on
live traffic instead of a static file.
🧪 Your turn
- Add a tool, watch the span tree grow. Attach a function tool to the agent (as in M3) and re-run section 5 — a
toolspan now nests underresponsesin your KQL results. - Trace token cost. Extend the KQL
projecttosum(output_tokens)grouped bymodelto see spend per deployment over the last hour. - Add a second rule. Create an eval object for
builtin.coherenceand a secondevaluation_rules.create_or_updatewith a newid, then confirm both appear vialist(project_client.evaluation_rules.list()).
✅ You wired OpenTelemetry to Application Insights, captured spans from a live agent call, and set up continuous evaluation that scores production traffic. Next: put guardrails around what your agent is allowed to say and do. → M11 · Guardrails